1. Introduction: The Missing Half of the Chart
In any other profession, making a life-altering decision without physical evidence would be considered malpractice. In trading, it’s the status quo. Most market participants spend their lives squinting at price candles, drawing sophisticated lines, and tracking lagging indicators, yet they ignore the single most critical piece of information on the chart: volume.
The problem is that price patterns alone only show you the “headline.” Without volume, you are blind to the conviction—the actual money—behind the move. To the untrained eye, volume is just a decorative bar at the bottom of the chart. To the professional, it is a truth-telling machine. This guide will reveal five counter-intuitive takeaways that transform volume from an afterthought into your most powerful confirmation layer.
2. Takeaway 1: Price is the Testimony, Volume is the Evidence
To read a chart like a strategist, you must adopt a fundamental mental model: Price and volume are not two separate indicators; they are a single conversation happening in real-time.
Price tells you what happened—the headline. Did the market go up, down, or sideways? Volume tells you if the move was real. Think of an election: Price is the result of who won, but volume is the voter turnout. If only ten people voted, the result is meaningless. If ten million people voted, it’s a mandate.
“Price is the testimony. Volume is the evidence. A witness can say anything. But without evidence behind it, the testimony means nothing. You would not convict someone on testimony alone. And you should not trade on price alone.”
3. Takeaway 2: The “Effort vs. Result” Framework
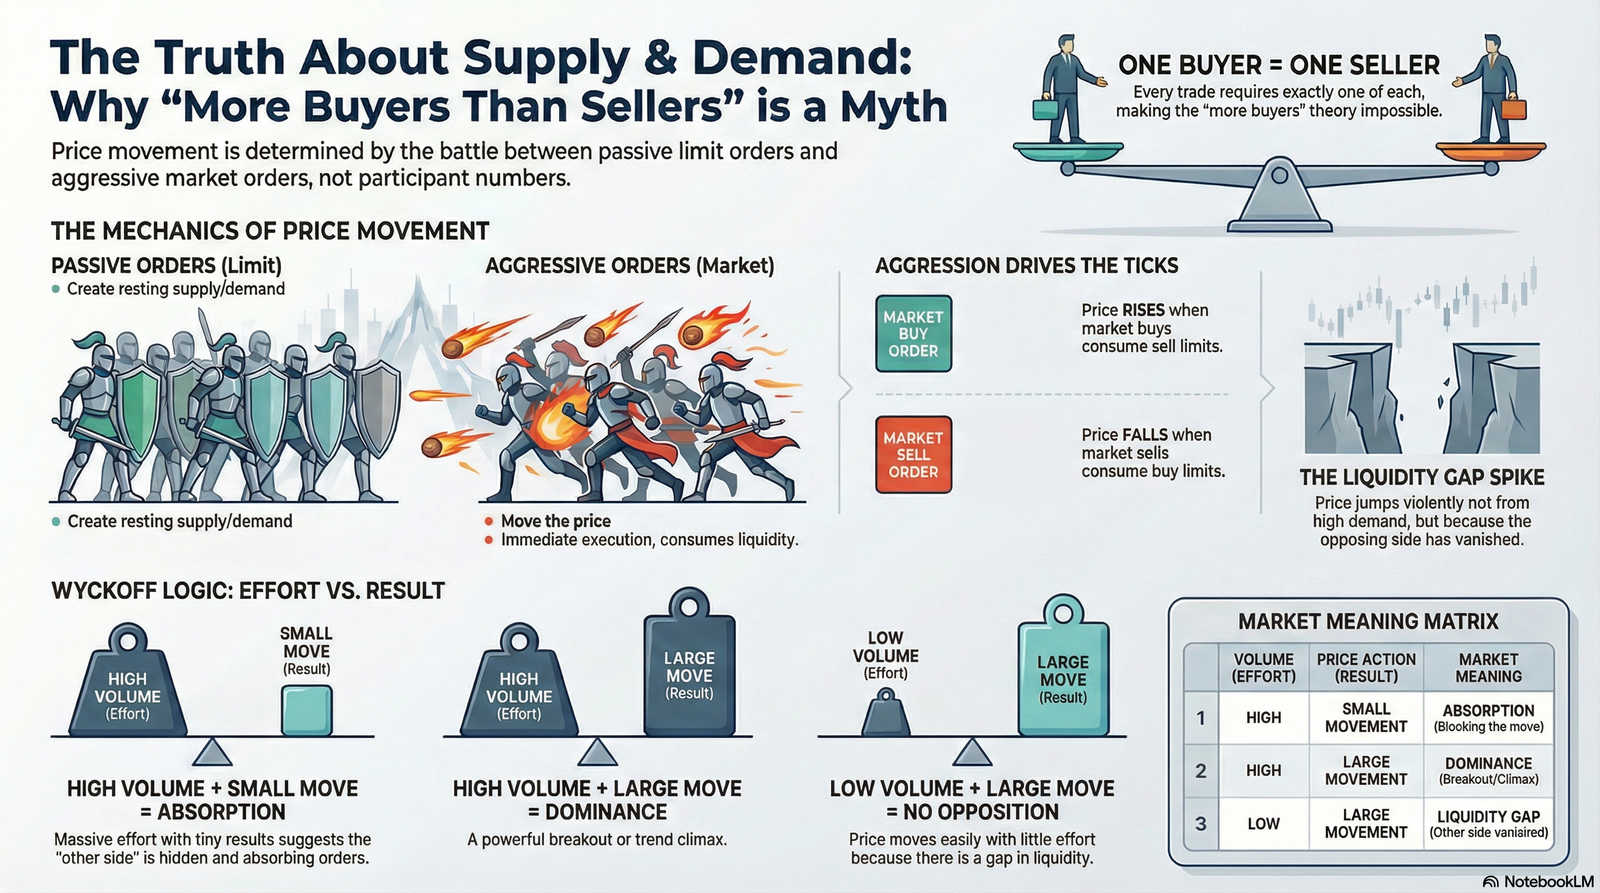
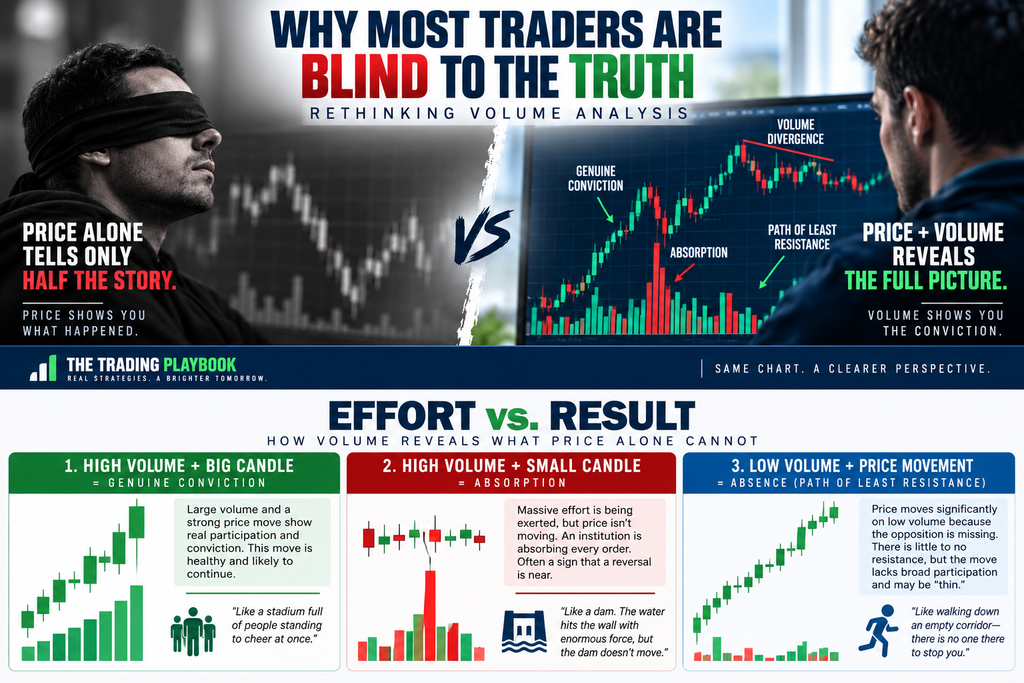
The bedrock of Volume Spread Analysis (VSA) is the relationship between EFFORT (Volume) and RESULT (the price candle’s spread). Effort is the energy and money being expended; the Result is how far the price actually moved as a consequence. When these two do not align, a reversal is often imminent.
| Case | Dynamics | Market State | Meaning |
| Case 1 | High Volume + Big Candle | GENUINE CONVICTION | Like a stadium full of people standing to cheer at once. The move is healthy, real, and likely to continue. |
| Case 2 | High Volume + Small Candle | ABSORPTION | Massive effort is being exerted, but price isn’t moving. An “invisible wall” (an institution) is absorbing every order. |
| Case 3 | Low Volume + Moving Price | ABSENCE | Price moves because the opposition is missing. You are walking down an empty corridor—there is no resistance. |
In ABSORPTION, think of a dam. The water (buying/selling pressure) hits the wall with enormous force, but the dam doesn’t move. Once the pushers exhaust themselves and the “water” runs out, the price often collapses or rips in the opposite direction because the wall never left. Professionals look for specific signals here:
- STOPPING VOLUME: A massive volume spike on a falling candle that closes off its lows. It’s the first evidence of smart money absorbing the panic.
- BUYING CLIMAX: A huge volume spike at the top of a trend where institutions use retail FOMO to unload their positions into the buying “rush.”
4. Takeaway 3: Debunking the Myth of the “Green Volume Bar”
One of the costliest mistakes retail traders make is believing that a green volume bar means “buying” and a red bar means “selling.”
The Actual Truth: Every trade requires a buyer and a seller. Volume simply counts the transactions. The color of the bar is just a mirror of the candle’s close—it tells you nothing about who is in control.
Think of a BUSY AUCTION ROOM. The room is packed (high volume), but you don’t know who is winning the bid until you see the final price. To find the truth, ignore the color. Look at the SIZE of the volume bar combined with the CLOSE POSITION of the candle. A tall bar with a candle closing in the middle of its range signals a battle and potential absorption, regardless of whether the bar is colored green or red.
5. Takeaway 4: The “Path of Least Resistance” Signal
It is a common paradox: price moving significantly on very low volume. This isn’t a sign of power; it’s a sign that the “other side” has left the building. This is the “Empty Corridor” effect.
- NO SUPPLY: Price rises on low volume. This happens not because buyers are aggressive, but because sellers are absent. There is no supply to stop the move.
- NO DEMAND: Price falls on low volume. This happens during pullbacks in a bull trend; it’s a “No Supply Test.” The market is asking, “Does anyone want to sell here?” If volume is low, the answer is “No,” and the uptrend is likely to resume.
These moves are “thin.” While the path of least resistance is clear for now, the move lacks the broad participation needed for a long-term trend.
6. Takeaway 5: The “Rocket Without Fuel” (Volume Divergence)
Volume Divergence is your early warning system, firing long before the price structure actually breaks. To understand this, you must distinguish between FUEL (Volume) and THRUST (Price Momentum).
Imagine a ROCKET. At launch, the fuel tanks are full and thrust is at a maximum. But as the fuel burns out, the thrust weakens. The rocket might still be moving upward due to inertia, but it is inevitably going to fall.
When you see price making new highs while volume bars get progressively smaller, the move is “running out of fuel.” The herd is still celebrating the new highs, but your “evidence” shows that fewer and fewer big players are participating. This divergence is the first sign that the trend is exhausted and a reversal is imminent.
7. The 5-Question Volume Checklist
Before you click “buy” or “sell,” run through this professional audit. Question 5 is the one most traders skip—and it’s the one that saves your capital.
- Is volume increasing or decreasing compared to recent bars? (Is participation growing or shrinking?)
- Does effort match result? (Are big volume bars producing big candles, or is there ABSORPTION?)
- Are there unusual volume spikes near key levels? (Anomalous volume at support/resistance is rarely random.)
- Is volume diverging from price? (Are we making new extremes on “dying” volume?)
- What does the next candle confirm? (PRO TIP: Patience for one additional candle eliminates the majority of false signals. A strong reversal candle after a volume spike confirms the move was real.)
8. Conclusion: Upgrading Your Analysis
Volume is not an indicator; it is the CONFIRMATION LAYER. It takes every concept you already know—liquidity sweeps, breakouts, and support/resistance—and provides the physical evidence that separates a high-probability setup from market noise.
Stop looking at volume bars as decoration. Start reading them as the truth. As you look at the charts today, ask yourself the one question that determines your longevity in this game:
Did you trade the testimony, or did you wait for the evidence?