Reading the Heartbeat: Why 1.64 Million Traders Provided the Liquidity for the October 2025 Collapse
1. The Ghost of October 2025
On October 10, 2025, Bitcoin reached a staggering all-time high of $126,000. Social media was a coordinated engine of euphoria; “TikTok gurus” and viral threads screamed of an imminent run to $150,000. For the retail crowd, the “Fear of Missing Out” reached a fever pitch, and they piled into long positions with reckless abandon.
Then, the structural reality of the market asserted itself. In a single, brutal cascade, Bitcoin didn’t merely pull back—it imploded to $12,000. In six hours, over $19 billion in long positions were liquidated, effectively erasing the capital of 1.64 million traders.
To the retail public, this was a “black swan,” an act of god, or a market conspiracy. To the professional analyst, however, the crash was printed on the charts three days prior. What the retail crowd missed was the fundamental “Heartbeat” of the market. Trading is not about discovering secret indicators; it is about synthesizing three specific layers of market truth that reveal institutional intent long before the first margin call.
2. Takeaway 1: Stop Choosing Sides—The Market is a Single Organism
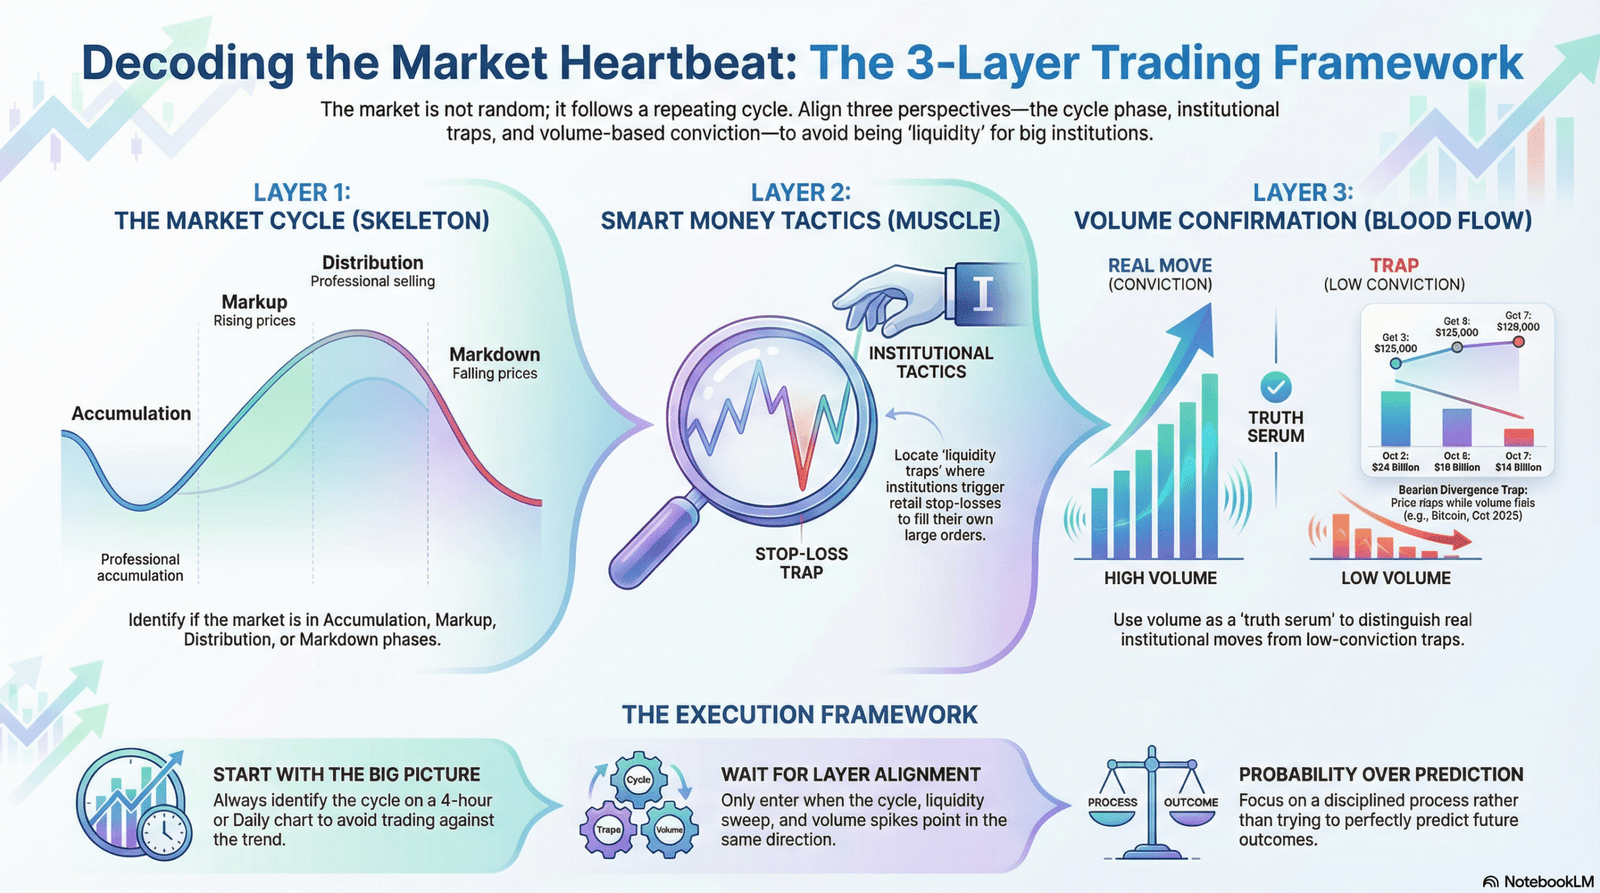
The primary barrier to retail success is tribalism. Traders often silo themselves into competing camps: Wyckoff purists, Smart Money Concept (SMC) advocates, or Volume Analysis specialists. A strategic analyst views these not as conflicting ideologies, but as integrated systems of a single organism.
“Think of it like studying anatomy. One doctor looks at the skeleton—the structure, the frame. Another doctor looks at the muscles—the movement, the action. Another looks at blood flow—the fuel, the energy. They’re all studying the same body; they’re just describing different systems.”
To achieve institutional-grade insight, you must link these lenses:
• Wyckoff Analysis provides the Macro Context (the skeleton).
• Smart Money Concepts provide the Entry Precision and tactical awareness (the muscles).
• Volume Analysis provides the Validation of intent (the blood flow).
Reflective Analysis: By synthesizing these layers, you transition from a single-strategy gambler to a technical practitioner. You no longer view candles as random noise, but as a cohesive narrative where structure, tactics, and energy align.
3. Takeaway 2: The Four-Act Story Every Market Tells
The market moves in a repeating, four-phase cycle known as the Wyckoff Cycle. Recognizing these phases allows you to distinguish between institutional absorption and retail exhaustion.
• Phase 1: Accumulation. The market is characterized by low volatility and sideways movement. It is clinically “boring.” Like watching someone “packing for a trip,” there is no visible excitement, but the preparation is immense. Institutions are quietly absorbing supply.
• Phase 2: Markup. This is the initiation of the trend. Price breaks out, and the news cycle turns aggressively bullish. As price pushes toward targets like $150,000, retail FOMO peaks. Critically, institutions are not buying here; they are preparing to sell into the very liquidity you are providing.
• Phase 3: Distribution. Volatility increases as price moves sideways. This phase is defined by “fake” breakouts and bull traps. While retail interprets this as a consolidation before another leg up, institutions are methodically unloading their positions.
• Phase 4: Markdown. The structural collapse. As the last retail buyer enters, the “floor” is removed. Stop-losses cascade, liquidations accelerate, and the market enters a freefall while institutions watch from the sidelines, fully liquid.
Reflective Analysis: Professional edge is rooted in the counter-intuitive. Success requires the discipline to buy when the market is “boring” (Accumulation) and the courage to exit when the market is “exciting” (Distribution).
4. Takeaway 3: Your Stop-Loss is Institutional Bait
Market participants often misinterpret structural necessity as personal victimization. The reality is mechanical: large institutions require massive pools of opposing orders—liquidity—to fill their positions without causing immediate price slippage.
Consider a hedge fund holding 10,000 Bitcoin. If they were to execute a market sell-off of that magnitude all at once, the price would collapse instantly, resulting in millions of dollars in losses due to slippage. To avoid this, they must manufacture a “liquidity pool” through a tactical “fishing” process:
1. The Bait: Institutions push price slightly above a key resistance level, triggering retail stop-losses and enticing breakout buyers.
2. The Bite: Retail traders enter “long,” providing a massive surge of buy orders.
3. The Catch: The hedge fund sells its 10,000 BTC directly into those retail buy orders. The retail buyers are effectively the exit liquidity for the “Smart Money.”
4. The Release: Once the institutional orders are filled, the lack of further buying pressure causes the price to snap back, triggering a liquidation cascade.
“It’s like fishing. You don’t just throw a net randomly into the ocean. You find where the fish are, you use bait, you wait, and then you pull.”
Reflective Analysis: This is not a conspiracy; it is a functional requirement for big money. Once you understand that your stop-loss is an institutional target, you stop being the “bait” and start becoming an observer of the hunt.
5. Takeaway 4: Volume is the “Truth Serum” for Price
If price is the “advertisement” for a move, volume is the “transaction.” Volume reveals whether a price move is backed by real institutional conviction or if it is a hollow trap. The October 2025 collapse was heralded by a classic “Volume Divergence.”
The Divergence Data:
• October 3rd: Bitcoin hits 123,000with∗∗24 billion** in volume.
• October 5th: Bitcoin hits 125,000with∗∗19 billion** in volume.
• October 7th: Bitcoin hits 126,000with∗∗14 billion** in volume.
Despite the “advertised” price reaching new highs, the actual “transaction” count was plummeting. The market was running out of steam.
“Price is the scoreboard; volume is the crowd in the stadium. If the scoreboard says your team is winning but the stadium is empty, something is wrong.”
On October 10th, the market saw one final, desperate “last gasp” spike to $122,000—a final liquidity grab—before the $12,000 crash began.
Reflective Analysis: A high-price move on declining volume is the ultimate warning sign. It indicates that the “stadium” is empty and the institutions have already left the building, leaving retail traders to hold the bag.
6. Takeaway 5: The Three Fatal Mistakes of the Retail Mindset
Technical knowledge is useless without the analytical discipline to execute. Professionals avoid three specific errors that routinely wipe out retail accounts:
1. Ignoring the Bigger Picture (Timeframe Blindness): Retail traders often identify a “perfect” bullish setup on a 15-minute chart. However, if that setup occurs during a 4-hour Distribution phase, they are trading directly into an institutional sell zone. Always align with the macro cycle.
2. FOMO vs. Data (Emotional Override): When the social media “stadium” is screaming, retail traders allow euphoria to override the data. They see the Divergence Data but enter anyway, driven by the fear of missing the next leg up.
3. Over-complicating the Process (Indicator Paralysis): Retail traders often bury their charts in 15 different indicators. This creates noise, not clarity. Professionalism is defined by simplifying the data to three core pillars: Cycle, Liquidity, and Volume.
Reflective Analysis: In high-stakes trading, capital preservation is the cornerstone of survival. Professionals understand that “not losing is winning.”
7. Conclusion: Becoming a Reader, Not a Fortune Teller
To survive the next market cycle, you must move away from prediction and toward a probabilistic framework:
• Identify the Cycle: Determine if the market is in Accumulation, Markup, Distribution, or Markdown (Daily/4-hour timeframes).
• Find Liquidity Zones: Locate where retail stops are clustered and where “traps” are likely to be set.
• Confirm with Volume: Ensure the “stadium” (volume) supports the “scoreboard” (price).
• Wait for Alignment: Only execute when all three layers point in the same direction.
Trading is not a deterministic science; it is the art of reading probabilities. By monitoring the “Heartbeat” of the market, you gain the edge required to stand with the institutions rather than becoming their liquidity.
Final Thought: Next time the “stadium” is empty but the scoreboard is screaming a win, will you have the discipline to stay on the sidelines?