Introduction to Technical Analysis
Technical analysis is a method used to evaluate and forecast the movement of securities’ prices by analyzing statistical trends from trading activity. This analytical approach focuses primarily on historical price data and trading volume, helping traders to make informed decisions regarding entry and exit points in the market. Unlike fundamental analysis, which emphasizes economic indicators and company performance, technical analysis relies on charts and graphs to predict future price movements based on past behavior.
One of the fundamental principles of technical analysis is the belief that market prices reflect all known information. This assumption underscores the concept that all market participants have access to similar data, and their collective actions ultimately determine price movements. By studying historical price trends, traders identify patterns and signals that may indicate potential future movements. For instance, common tools used in technical analysis include moving averages, trend lines, and various chart patterns, such as head and shoulders or double tops. These tools help traders to gauge market sentiment and to determine whether the trend is bullish or bearish.
Moreover, technical analysis works on the premise that prices move in trends. Historically, markets have tended to reflect certain patterns over time, and by recognizing these patterns, traders can make educated predictions about future price behavior. Traders also utilize indicators, such as the Relative Strength Index (RSI) or MACD, to further refine their analysis, offering a clearer sense of momentum or overbought/oversold conditions. Understanding these basic concepts equips traders with the foundational knowledge necessary to develop their technical analysis systems, providing a structured approach to navigating the complexities of market trading.
Understanding Market Structure and Price Action
In the realm of technical analysis, price action serves as a fundamental element that reflects the prevailing sentiments within the market. By observing price movements over time, traders can garner insights into the supply and demand dynamics driving a particular asset. Price action does not merely signify the current price but reveals the psychology of market participants, making it crucial for traders to interpret these movements accurately.
One of the key aspects of price action is its ability to demonstrate patterns that indicate potential future movements. Common patterns such as candlestick formations, trend lines, and chart formations serve as visual representations of market psychology, aiding traders in making informed decisions. Recognizing these patterns enables traders to anticipate reversals or continuations in price trends, creating opportunities for strategic entry and exit points.
Additionally, understanding market structure is vital for effective trading. Market structure encompasses the organization of price movements and is characterized by the identification of support and resistance levels. Support refers to a price point where buying interest is strong enough to prevent the price from declining further, while resistance indicates a price level where selling pressure emerges, stalling upward movements. These levels are not arbitrary; they represent areas where traders have historically reacted, reflecting collective anticipation of price behavior.
By integrating the analysis of price action with an understanding of market structure, traders can enhance their decision-making processes. This dual approach enables them to identify high-probability setups, minimize the risk of false breakouts, and refine their overall trading strategy. Moreover, recognizing shifts in market structure can help traders adapt to changing conditions, fostering a more robust analysis framework. Therefore, developing an awareness of both price action and market structure is essential for any trader aiming to navigate the complexities of financial markets effectively.
Incorporating Moving Averages
Moving averages play a crucial role in developing a robust technical analysis system, assisting traders in identifying trends and making informed decisions. There are two primary types of moving averages: simple moving averages (SMA) and exponential moving averages (EMA). The SMA is calculated by taking the arithmetic mean of a set of prices over a specific number of periods, providing a clear, smoothed representation of price movement. On the other hand, the EMA places greater weight on recent prices, making it more responsive to new information, which can be particularly useful in volatile markets.
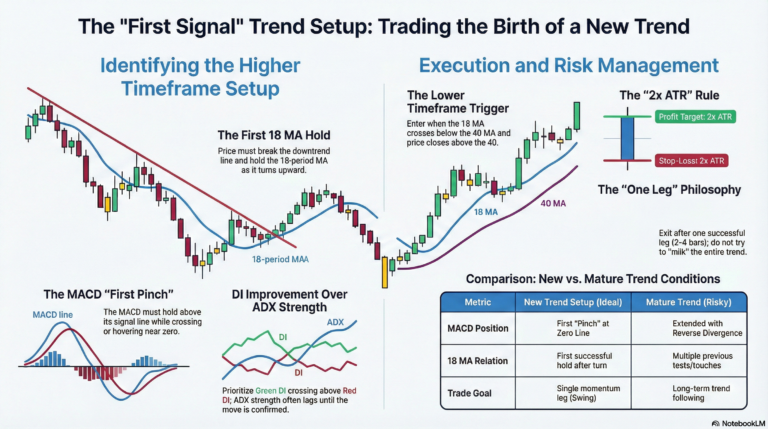
To apply moving averages effectively, one must first decide on the relevant time frame, which can vary based on trading style. For instance, long-term traders may utilize a 50-day or 200-day moving average to identify major trends, while day traders might prefer shorter averages, such as the 5-day or 10-day moving average. Once the moving averages are established, they serve as dynamic support and resistance levels, indicating potential areas for price reversal or continuation. I recommend a combination of moving averages combining a shorter term such as a 10 day, along with an intermediate term such as a 20 day and finally a longer term such as the 50 and or the 200 day. Multiple moving averages can help easily identify the trend strength as when they are “stacked” (shorter above immediate which is above longer term) one can see the trend is aligned and the separation between the different moving averages can indicate trend strength as well as warn of possible mean reversion if price gets too far overextended above the moving average.
Another critical aspect of moving averages in technical analysis is the concept of crossovers. A crossover occurs when a shorter-term moving average crosses above or below a longer-term moving average. For example, when a 10-day EMA crosses above a 50-day EMA, it generates a bullish signal, indicating a potential upward price movement. Conversely, a bearish signal is produced when the shorter-term EMA crosses below the longer-term EMA. Traders can use these crossovers as entry or exit points, making them invaluable for recognizing potential trading opportunities in the market.
Utilizing Momentum Indicators
Momentum indicators play a vital role in the realm of technical analysis, helping traders gauge the strength of market movements. These indicators measure the rate at which the price of an asset changes over time, allowing traders to make informed decisions based on market dynamics. One of the most widely used momentum indicators is the Relative Strength Index (RSI), which classifies price actions on a scale of 0 to 100. This index provides valuable insight into whether a market is overbought or oversold, serving as a pivotal tool for traders seeking to identify potential reversal points.
The RSI is calculated based on average gains and losses over a specified period, typically 14 days. A reading above 70 generally indicates that a security may be overbought, suggesting that a corrective price pullback might occur. Conversely, an RSI reading below 30 is considered oversold, indicating potential upward momentum in the future. Traders often utilize these levels to either confirm existing positions or to identify the opportune moment to enter or exit a trade.
While the RSI is a powerful tool, it’s essential for traders to align these momentum readings with prevailing price trends. For example, if the price continues to rise but the RSI begins to trend downward, this divergence may suggest weakening momentum, alerting traders to potential risks. Integrating additional momentum indicators, such as the Moving Average Convergence Divergence (MACD) or Stochastic Oscillator, can further enhance analysis but one also runs the risk of too many indicators that do essentially the same thing. I would recommend you find one momentum based indicator that resonates with you and learn to use it effectively rather than over complicate your charts with too many similar indicators.
Incorporating Oscillators in Analysis
In technical analysis, oscillators are vital tools that help traders identify market trends and reversals, particularly under challenging conditions such as sideways markets. These indicators fluctuate between defined values and serve to highlight potential changes in momentum, making them instrumental in validating existing market trends. Among the most commonly used oscillators are the Stochastic Oscillator and the Moving Average Convergence Divergence (MACD), both of which offer meaningful insights into market conditions.
The Stochastic Oscillator compares a security’s closing price to its price range over a specified period. Its scale ranges from 0 to 100, where readings above 80 typically indicate an overbought condition, while readings below 20 suggest an oversold condition. Traders often look for divergences with price action; for instance, if the price is making new highs while the oscillator is not, this can signal a potential reversal. Moreover, crossovers of the oscillator’s %K and %D lines can produce actionable buy or sell signals, enhancing the trader’s decision-making process.
Similarly, the MACD, which consists of two moving averages and a signal line, provides insights into the strength and direction of a market trend. It is calculated by subtracting the longer-term moving average from the shorter-term moving average. When the MACD crosses above the signal line, it can indicate a bullish trend, while a crossover below may suggest a bearish trend. Additionally, traders note divergences between MACD values and price movements as a potential indicator for trend reversals.
In summary, oscillators offer significant advantages to traders by providing clearer signals of market reversals and trends. By effectively incorporating these tools into a technical analysis system, one can enhance the ability to navigate various market conditions and improve trading outcomes.
Understanding Volume Dynamics
In the realm of technical analysis, volume serves as a vital indicator for interpreting market movements. It represents the total number of shares or contracts traded for a specified period, providing insights into the level of interest and activity surrounding a particular asset. Analyzing trading volume can help traders confirm price movements rather than relying solely on price trends, as it reflects the strength behind those trends.
Price Movements and Volume Correlation
The correlation between price action and volume is essential for effective trading strategies. Typically, when a price movement occurs alongside increased trading volume, it suggests strong conviction among traders and a sustainable trend. Conversely, if a price change arises with low volume, it may indicate a lack of confirmation, leading traders to be cautious. For instance, an uptrend facilitated by a significant volume surge strengthens the argument that buyers are actively participating in the market, while a decline in volume during an uptrend could signal potential reversal or weakness in the trend.
Utilizing Volume Spikes
Volume spikes can also serve as critical indicators for traders. A sudden increase in trading volume can signify significant market interest, often preceding major price movements. For example, if a stock experiences a spike in volume following a price breakout, it can enhance the trader’s confidence in the indicator’s validity. Evaluating the context in which volume spikes occur is imperative; traders should consider whether these spikes align with important news events or earnings announcements, as such factors can amplify price volatility. By leveraging volume analysis, traders can enhance their momentum assessments and validate their trading decisions.
Conclusion on Reading Volume
In conclusion, mastering the interpretation of volume dynamics not only aids in confirming price movements but also enhances a trader’s ability to make informed decisions. Understanding the relationship between volume and price action, as well as recognizing volume spikes, is essential for developing a robust technical analysis system aimed at identifying market direction.
Market Cycles and the Wyckoff Method
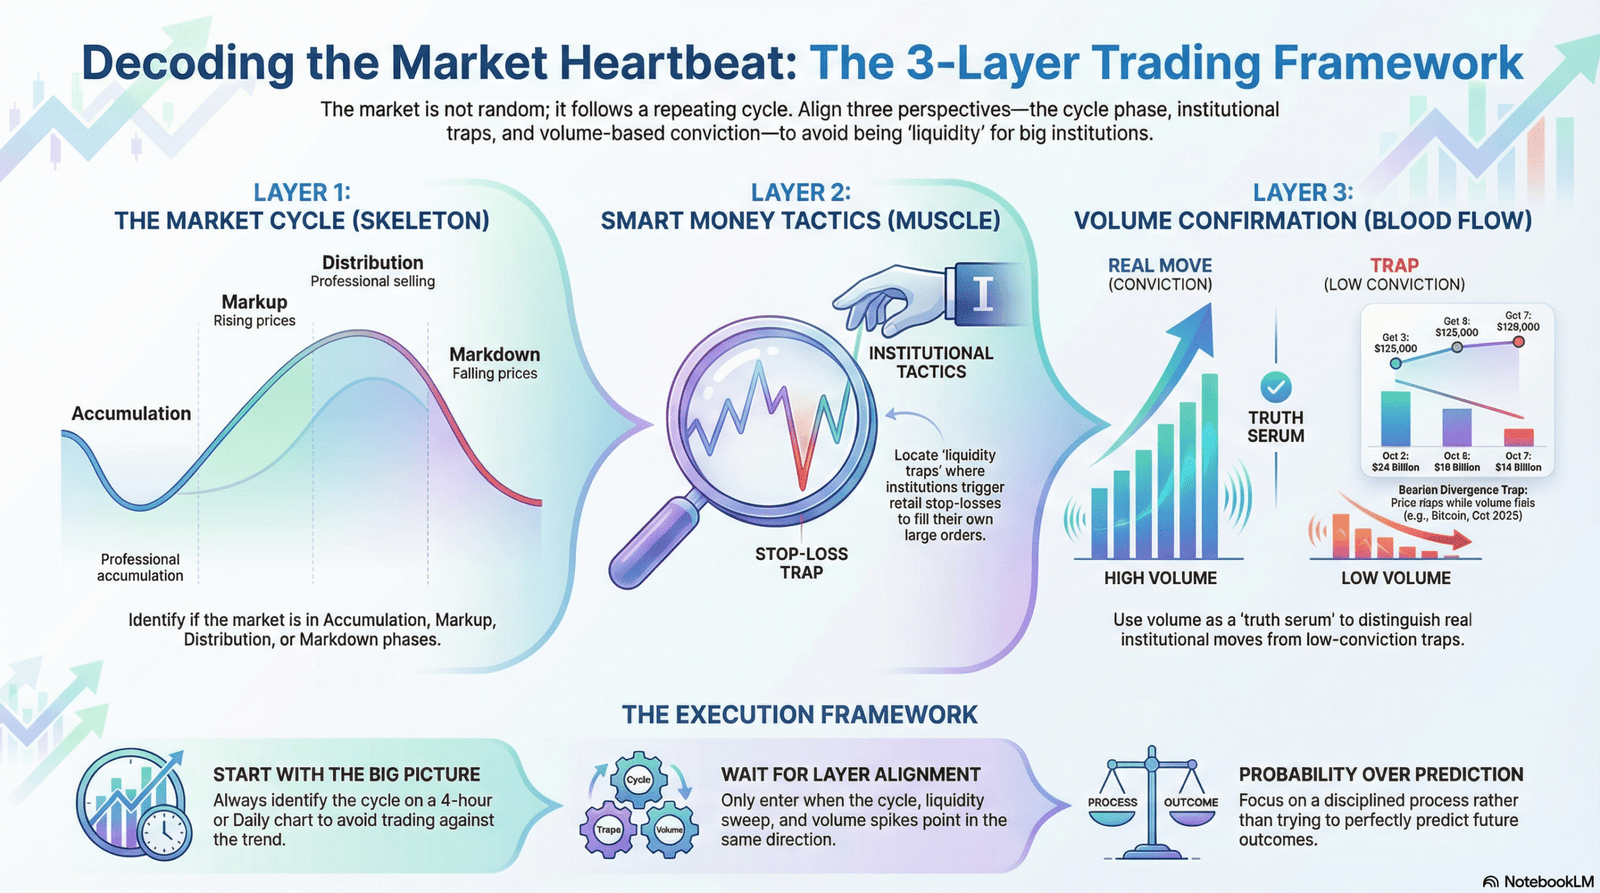
Understanding market cycles is critical for traders looking to create a robust technical analysis system. One insightful approach is the Wyckoff Method, which offers a framework to interpret market behaviors over time. According to this method, a market cycle is composed of four distinct phases: accumulation, markup, distribution, and markdown. Each phase represents a unique stage of market activity that can inform trading strategies.
The first phase, accumulation, occurs when savvy investors and institutions begin purchasing assets at lower prices in anticipation of future price increases. Generally, this phase is marked by sideways price movement and low trading volume, as knowledgeable traders accumulate positions while the broader market remains unaware. Recognizing this pattern can help traders anticipate potential price movements before a new trend emerges.
The second phase is markup, characterized by increasing prices as demand exceeds supply. During this period, sentiment begins to shift positively, leading to a surge in trading volume. Traders should look for bullish signals and confirmatory patterns during this stage, as they can align their strategies with the prevailing upward momentum.
The third phase, distribution, reflects a shift in supply and demand dynamics as smart money begins to sell and take profits. This period often mirrors the accumulation phase in terms of volume but is typically marked by more volatility. Identifying distribution signals can help traders recognize when to exit positions to avoid significant losses.
Finally, the markdown phase sets in as prices decline, driven by excess supply from distribution. This downward trend alerts traders to the shifting landscape, prompting them to reassess their strategies and adapt accordingly. By incorporating the Wyckoff Method into a trading system, market participants can gain valuable insights into these phases, ultimately leading to improved trading decisions and greater potential for profitable outcomes.
Developing a Trading Plan Based on Analysis
Creating a robust trading plan is crucial for any trader aiming to navigate the complexities of financial markets effectively. Integrating findings from technical analysis into this plan not only provides a structured framework but also enhances the likelihood of achieving favorable outcomes. The first step in this process is to clearly define market entry and exit points based on analytical indicators, such as support and resistance levels, moving averages, and various technical oscillators.
Setting these entry and exit points requires a thorough examination of historical price movements and patterns identified through technical analysis. For example, a trader might utilize momentum indicators to identify optimal entry points, ensuring that trades are executed when market momentum is favorable. Conversely, exit points can be established using stop-loss orders, which provide a safeguard against significant losses by automatically closing a position at a predetermined price.
Risk management strategies form another fundamental aspect of the trading plan. Traders must delineate acceptable levels of risk for each trade, often recommended to be a small percentage of the total trading capital. This involves calculating risk-to-reward ratios, which help ensure that potential returns justify the risks taken. By employing consistent risk management techniques, traders can safeguard their investments while maximizing profit potential.
Lastly, it is important to develop a consistent routine that allows traders to apply their technical analysis system across diverse market conditions systematically. This may include regular reviews of market trends and adjustments to trading strategies based on recent analysis. A disciplined approach that adheres to the trading plan can mitigate emotional decision-making, ultimately leading to a more consistent trading performance and long-term success in achieving market objectives.
Conclusion and Next Steps
In conclusion, developing a comprehensive technical analysis system plays a critical role in determining market direction. A well-structured approach to technical analysis not only enhances trading decisions but also helps traders to understand market trends and patterns more effectively. By employing various tools and indicators, traders can develop insights that inform their strategies and risk management practices.
As you embark on creating your technical analysis system, it is important to keep the principles discussed throughout this blog in mind. Focus on utilizing a blend of fundamental and technical analysis to better evaluate market conditions. Regularly assess the performance of your system and make necessary adjustments based on the feedback and outcomes you observe. This iterative process allows for continuous improvement and adaptation to changing market dynamics.
Furthermore, staying informed about the latest developments in the financial markets is essential. Engage in ongoing learning by following reputable sources, attending webinars, and participating in forums where traders share insights and experiences. The discipline of trading requires commitment, and consistent effort will lead to better decision-making and successful trading practices over time.
Lastly, remember that emotional resilience and a well-defined trading plan will contribute significantly to your trading success. By integrating the technical analysis strategies learned, while remaining adaptable, you can navigate the complexities of the market with greater confidence. Embrace the journey of learning and refining your trading techniques, as this commitment will ultimately lead to more informed decisions and fruitful trading endeavors.