The Market’s Truth Serum: Why Volume Tells the Story Price Tries to Hide
I see traders making the same mistake every single day: they stare at the candles while completely ignoring the engine room. They spend hours obsessing over price patterns and lines, but they are essentially judging a restaurant solely by the sign outside without ever checking if there are actually any customers inside.
In my decades of analyzing markets, I’ve learned one absolute truth: Price is merely the “advertisement.” It tells you what happened—whether the market went up, down, or sideways. Volume, however, is the actual transaction. It tells you how much conviction was behind that move. It is the evidence and the physical proof of money changing hands. If price is the result of an election, volume is the voter turnout. A victory means very little if only ten people voted; it becomes a declaration of war when ten million show up. To see the truth, you must look past the headline and examine the participation.
Takeaway 1: The “Effort vs. Result” Mental Model
To read volume like a professional, you only need one central mental model: Effort versus Result. In this framework, Volume represents the “Effort” (the energy and money being expended), while the Price Candle represents the “Result” (how far the price actually traveled).
Think of it like pushing a car up a hill. When you press the gas pedal (Effort) and the car moves forward smoothly (Result), the two are in harmony. On a chart, this appears as a large candle accompanied by high volume. This indicates a “Healthy Move” where the conviction is high. When you see this alignment, it is like a whole stadium standing up to cheer—it represents genuine excitement and a move that is likely to have legs.
To help you internalize this, keep this Volume Matrix in your mind:
| Effort (Volume) | Result (Candle) | Market Meaning |
|---|---|---|
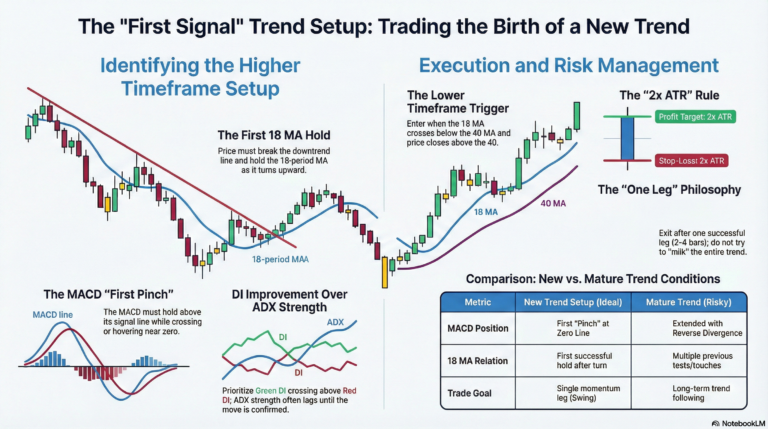
| High | Large | Healthy Move: Conviction and result are in harmony. |
| High | Small | Absorption: A warning sign; big effort but someone is blocking the path. |
| Low | Moving | No Supply/Demand: One side is absent; the road is empty. |
Takeaway 2: The Silent Wall of Absorption and Stopping Volume
The most dangerous trap you can fall into is ignoring the scenario where massive effort yields a tiny result. Imagine slamming the gas pedal until the engine roars, but the car barely moves. There is a wall in your way.
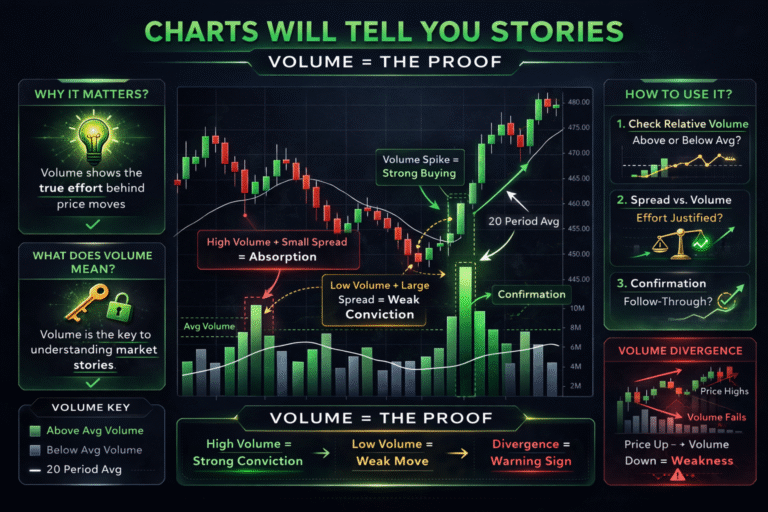
On your chart, this manifests as a tiny candle sitting on top of massive, spike-level volume. This is Absorption. While it looks like buyers are pushing hard, “Smart Money” (institutional sellers) is sitting there quietly absorbing every single buy order. It’s like a dam holding back a flood; once the buyers exhaust themselves, the price often drops sharply.
However, this mechanic works both ways. You must also watch for Stopping Volume at the bottom of a crash. When you see a tall red candle on huge volume that fails to close at its lows—leaving a long wick and closing near the middle—you are seeing smart money stop the crash with cash, not words. They are buying everything the panicking public is throwing away. This high-effort, small-result scenario is a primary signal that a reversal is brewing.
Takeaway 3: The Buying Climax—Selling Disguised as Buying
Retail traders often get crushed by FOMO when they see a massive green candle on extreme volume at the end of a long uptrend. To the amateur, this looks like incredible strength. To the veteran, this is a Buying Climax.
This is strong selling disguised as buying. Institutional players use the flood of retail buy orders to unload their massive positions without crashing the price immediately. They are selling into the demand. It is like a vendor at a night market using the busiest moment of the evening to clear out the last of his stock. By the time you jump in at the top, the smart money has already walked out the door with your capital.
Takeaway 4: Debunking the Volume Bar Color Myth
If you think a green volume bar means buying and a red one means selling, you are reading the chart wrong. Every single trade requires both a buyer and a seller. Volume simply counts the number of transactions—the “busyness” of the market.
The color of the volume bar is purely cosmetic; it just mimics the color of the price candle. To understand who is actually winning the territory, you must ignore the color and follow this rule: Size plus Close Position.
• Size: How much activity occurred? (Is the market “busy”?)
• Close Position: Where did the candle close relative to its range? (Did the buyers or sellers push the other side back before the whistle blew?)
If the candle closes near the top of its range on high volume, the buyers won that round, regardless of whether the bar is colored red or green by your software.
Takeaway 5: Divergence as the Market’s Fuel Gauge
Volume Divergence is your early warning system. When price and volume agree, the trend is healthy. When they disagree, the market is running out of gas.
• Upside Exhaustion: If price is making new highs but volume is getting smaller, the move is losing thrust. Think of a rocket that has used up its fuel; it may still be drifting upward, but it will eventually fall. It’s like the applause getting quieter after each speech—the audience is losing interest.
• Downside Exhaustion: If price is falling but volume is dropping too, the selling is drying up. Fewer traders are willing to participate in the move lower, which often signals a bottom is forming.
The 3-Step Volume Playbook
Before you pull the trigger on your next trade, I want you to run through this disciplined process:
1. Zoom Out: Look at the daily or weekly charts. Is the overall volume trend increasing or decreasing? Check the “climate” before you worry about the “rain” of an individual candle.
2. Zoom In to Key Levels: Watch the reaction at major support and resistance. If price hits resistance on a volume spike but the candle stays small, that’s absorption—the wall is holding. If it breaks through on high volume with a large candle, the move is real.
3. Wait for Confirmation (The Golden Rule): Never act on a single candle. After a breakout, wait for a pullback. If that pullback occurs on very low volume, it is a “No Supply Test.” This is the ultimate confirmation that sellers are absent and the path of least resistance is back up. Patience for that one extra candle will save you from a thousand traps.
Conclusion: Beyond the Candles
Volume is the only indicator that doesn’t lag because it represents the actual energy flow of the market. While price can be manipulated or pushed around in the short term, volume reveals where real commitment—the “Smart Money”—is actually stepping in. By mastering the relationship between effort and result, you stop guessing and start reading the evidence.
As you open your charts tomorrow, look for the truth behind the advertisement. Which pattern will you look for first: the bottom-fishing Stopping Volume, the deceptive Buying Climax, or the early warning of Volume Divergence?