The Invisible Hand of Options: Why the “Gamma Flip” Is the Critical Level Every Trader Needs to Watch
1. Introduction: The Ghost in the Machine
Have you ever witnessed a market sell-off that seemed to gain a terrifying, unexplained momentum, or a rally that suddenly stalled against an invisible ceiling? To many traders, these violent shifts feel like random noise. However, there is a hidden force beneath the surface of the price charts: Gamma Exposure (GEX).
Gamma Exposure represents the hedging requirements of market makers—the large institutional “dealers” who sit on the other side of almost every option trade. Because these dealers must constantly rebalance their books to remain neutral, their collective buying and selling dictates the very rhythm of market volatility. By understanding GEX and the critical “Gamma Flip” point, traders can stop guessing and start anticipating how these institutional requirements will drive price action.
2. Takeaway 1: The Market’s Invisible Brake and Gas Pedals
To understand market mechanics, one must understand that dealers are in the business of remaining “Delta Neutral.” Delta measures the direction exposure of an option. As the price of a stock moves, the Delta of the dealers’ options positions changes, and they must buy or sell the underlying stock to offset that change. Gamma is the rate at which that Delta changes.
This creates two distinct market regimes:
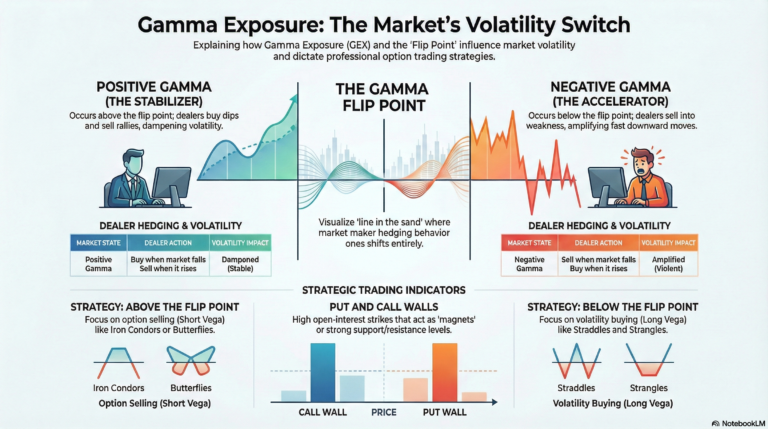
- Positive Gamma (The Stabilizer): In this regime, dealers generally act as a dampening force. When the market dips, they buy the underlying; when it rallies, they sell. This activity keeps price action rangebound and suppresses volatility.
- Negative Gamma (The Accelerator): Once the market shifts into negative gamma, the behavior flips. Dealers are forced to hedge in the same direction as the market move—selling into weakness and buying into strength to maintain neutrality. This amplifies price swings and causes downtrends to pick up speed with frightening efficiency.
“Positive gamma the market makers buy stocks when the market falls and they sell stocks when it rallies… volatility is dampened.”
This dynamic is often counter-intuitive. In a negative gamma environment, the very entities that usually provide liquidity are forced to “chase” the trend to protect their books, effectively fueling the fire of a market move.
3. Takeaway 2: The “Line in the Sand” (The Gamma Flip Point)
When we examine the market through the lens of GEX, the most important level to identify is the Gamma Flip Point. This is the specific price threshold where dealer behavior transitions from dampening volatility to accelerating it.
Consider it a “line in the sand.” Above this point, the market feels stable and “choppy” in a way that favors rangebound trading. Below this point, price swings become significantly more violent.
Market Snapshot: The SPY Example
In a recent analysis of the SPY ETF, the price was trading at 650, while its Gamma Flip Point was identified at 646.97. Despite the market appearing healthy, it was less than one percent away from a regime shift. Should the price cross that 646.97 threshold, the aggregate gamma exposure flips negative, and losses could “pick up steam” as dealers begin forced selling.
Pro-Tip for Traders: You must monitor these levels daily. When the price is near the flip, “price swings can get much more violent” in an instant. If you aren’t checking the flip daily during periods of proximity, you are trading blind to the accelerator.
4. Takeaway 3: Magnetic Levels—The Power of Put and Call Walls
Beyond the flip point, traders must track “Put Walls” and “Call Walls”—strike prices characterized by exceptionally large open interest. These levels function as mathematical barriers that influence price movement through hedging flows.
- Call Walls (The Ceiling): High concentrations of call open interest often act as a hard ceiling. As the price approaches these levels, dealers must sell the underlying stock to hedge their increasing Delta, causing the price to stall. For example, Nvidia (NVDA) has shown a significant call wall at 175, while Palantir (PLTR) has a similar wall at 165. These are “magnetic levels” where the price is drawn in but often fails to break through.
- Put Walls (The Floor): These represent large concentrations of put open interest and typically act as support. However, beware: in a negative gamma regime, a stock might “blow right through” a put wall. Below the flip, dealers stop providing a floor and start selling as the price falls, turning a previous support into a vacuum.
Strategy Insight: At these walls, particularly call walls like the 165 level in PLTR or 175 in NVDA, the Butterfly Spread is an elite tool. Because the price is likely to “pin” or stall at the wall, a butterfly allows you to profit from stability while benefiting from “Negative Vega”—a drop in volatility as the price settles at the strike.
5. Takeaway 4: Strategy Alignment—Matching Your Trade to the Gamma Regime
As an educator, I cannot stress this enough: do not fight the regime. Align your strategy with the prevailing hedging forces.
Above the Flip (Positive GEX)
- Market Environment: Low volatility, stable, rangebound.
- Preferred Strategies: Option selling strategies such as Iron Condors, short straddles, or short strangles.
- Objective: Profit from time decay and “Negative Vega” (falling volatility).
Below the Flip (Negative GEX)
- Market Environment: High volatility, directional acceleration, “vicious” moves.
- Preferred Strategies: Long straddles, long strangles, or any “Positive Vega” trades.
- Objective: Profit from large price swings and increasing volatility.
Case Study: Lululemon (LULU)
When we examine Lululemon, we see a textbook case of a stock stuck in a “nasty downtrend.” Because it stayed consistently below its gamma flip point of 191, it remained in a regime where every downward move was amplified by dealer hedging. In such a “vicious” environment, bottom-fishing with short options is dangerous; the regime favored long volatility (Positive Vega) plays until the flip point was reclaimed.
The Temporal Nuance: Looking at Expirations
It is also vital to look at gamma across different expiration cycles. For instance, while the Nasdaq (QQQ) may show negative or neutral gamma in the near-term, there is often a significant cluster of positive gamma for the December expiration. This suggests that once short-term volatility rolls off, the larger institutional positioning for the end of the year could provide a stabilizing “good sign” for the market.
6. Conclusion: Looking Beneath the Surface
Gamma exposure, flip points, and walls do not predict the market’s direction on their own. Instead, they provide an essential layer of context, revealing the mechanical forces at work beneath the surface of price action. By identifying whether the market is in a stabilizing or accelerating regime, you can better anticipate support and resistance zones and manage your risk accordingly.
The next time the market starts to slide, will you know where the “flip” is, or will you be caught in the accelerator? In a market increasingly dominated by options positioning, knowing where the dealers are forced to trade is no longer optional—it is a requirement for survival.