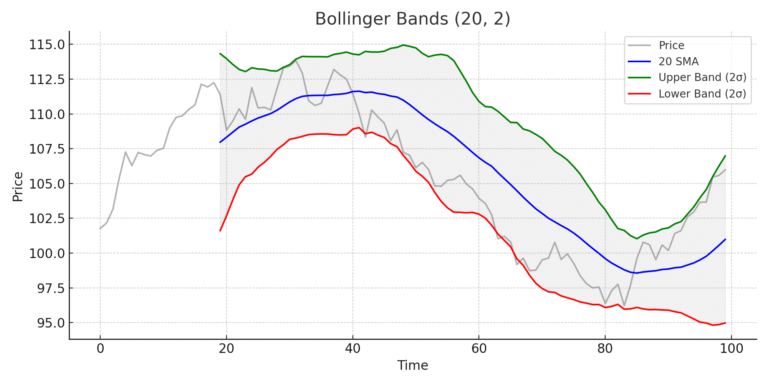
Bollinger Bands were created by John Bollinger in the 1980s, and are one of the most versatile and widely used volatility indicators in technical analysis.
They consist of three components:
- A moving average (typically 20-period SMA)
- An upper band = MA + (2 * standard deviation)
- A lower band = MA – (2 * standard deviation)
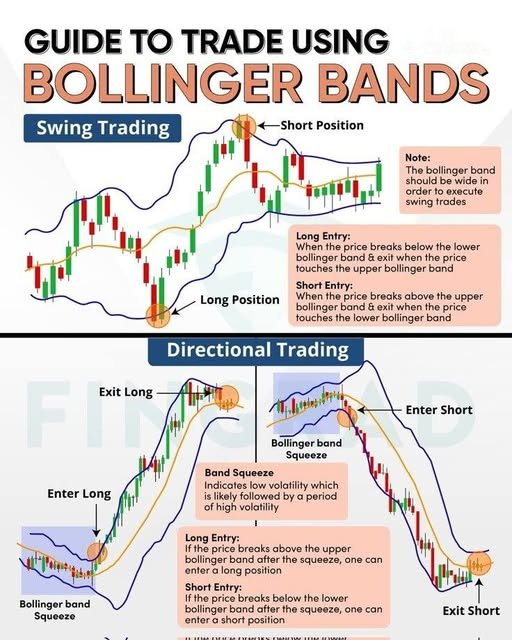
The bands expand and contract based on market volatility. Bollinger Bands are not buy or sell signals by themselves, but a framework for judging price action.
John Bollinger’s Core Principles:
- Use Bollinger Bands with price action, volume, and confirmation indicators.
- Band “tags” are not reversal signals by themselves.
- Price can “walk the band” in strong trends.
- Look for squeezes (low volatility) followed by breakouts.
Key Bollinger Band Strategies:
- The Squeeze
- Bands contract during low volatility.
- A breakout from the squeeze often leads to strong directional moves.
- Confirm with volume surge or trend indicator (e.g., MACD).
- Riding the Band
- In trending markets, price may hug the upper or lower band.
- In an uptrend: buy near middle band (20-SMA), exit near upper band.
- In a downtrend: short near middle band, cover near lower band.
- Double Bottom with Band Tag
- First low touches lower band, second low holds above band.
- Used as a bullish reversal setup, especially when RSI confirms divergence.
- Reversal on Exhaustion
- Price pierces upper/lower band with high volume and reversal candlestick.
- Watch for pin bars or engulfing candles.
- Best when combined with overbought/oversold indicators.
John Bollinger’s Favorite Confirmation Tools:
- Relative Strength Index (RSI)
- Volume indicators (e.g., On-Balance Volume)
- Pattern recognition (double bottoms, W-bottoms)
Common Misconceptions:
- Bollinger Bands are NOT static buy/sell zones.
- Price crossing a band does NOT mean automatic reversal.
- Bands must be interpreted in context with trend and volatility.
Recommended Settings:
- 20-period SMA
- 2 standard deviations
- For faster reaction: use 10-period SMA with 1.5 std dev
- For smoother signals: 50 SMA with 2.5 std dev (used in longer timeframes)
Bollinger Bands work best when combined with other signals in a rule-based system. They are a volatility lens to help traders identify breakout conditions, mean-reverting moves, and continuation patterns with clarity.
Visual Example: Bollinger Bands